

How to add rows for dates between start and end dates in Power BI
Within PowerBI sometimes you have a need to expand the data between two dates to split the data into days and rows.
A good example is calculating revenue on a certain day or populating a schedule visual that uses individual days.
In Power BI there are several custom visuals available, such as “Calendar by Tallan” that show the density of events over time.
However, if your data includes date ranges (start date with a different end date, such as task/project lists), visuals like these will only understand one of the two dates and none of the dates in between will be Calculated, making your data visualization incorrect.
You can, however, “expand” these date ranges or durations to create rows for all the dates including start, end and those in between. This way each date that’s part of the range is then graphed appropriately, and you can then create other custom columns to work out financials.
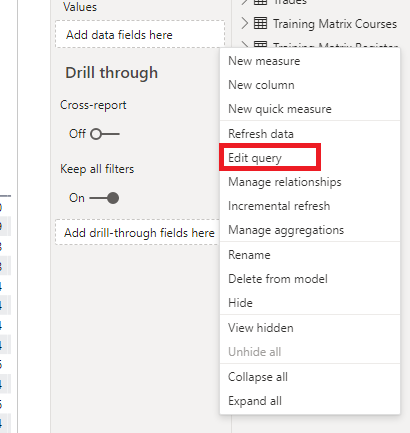
1) Right Click on your table “Edit queries” to open Power Query editor
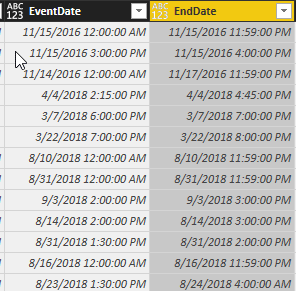
2)Make sure your date columns are date (not date/time) format
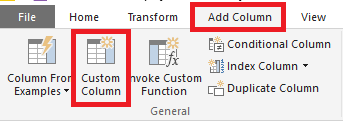
3) Create a custom column
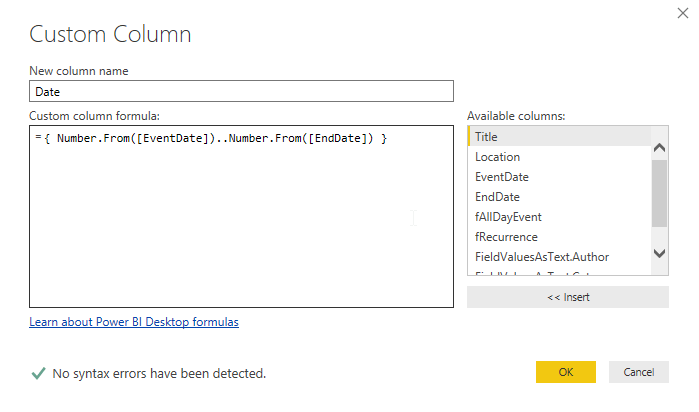
4) Change the name to “Date” and paste the following after the equals (“=”) sign: then click OK.
{ Number.From([EventDate])..Number.From([EndDate]) }
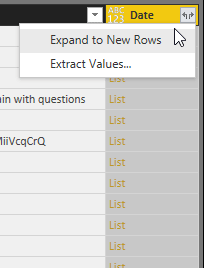
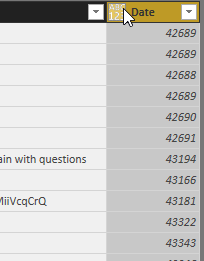
5) Click the “diverging-arrow” icon next to “Date” and click “Expand to new rows”. Notice the addition of new rows.
6) Change the column type to “Date”
7) Click “Close and Apply”
You know have rows for each day between your dates, which you can use in visuals !!!! you can now add other custom columns to calculate revenue for example.